
SPI Packaging Strategy & Growth: Market Entry, Segment Priorities, Pricing and Go-to-Market Plans
SPI Packaging Strategy & Growth helps packaging manufacturers, converters and brand-owner packaging teams decide where to grow next, which segments, formats or countries to prioritise, and how to price and go to market, with each option scored on stated criteria and sourced evidence.
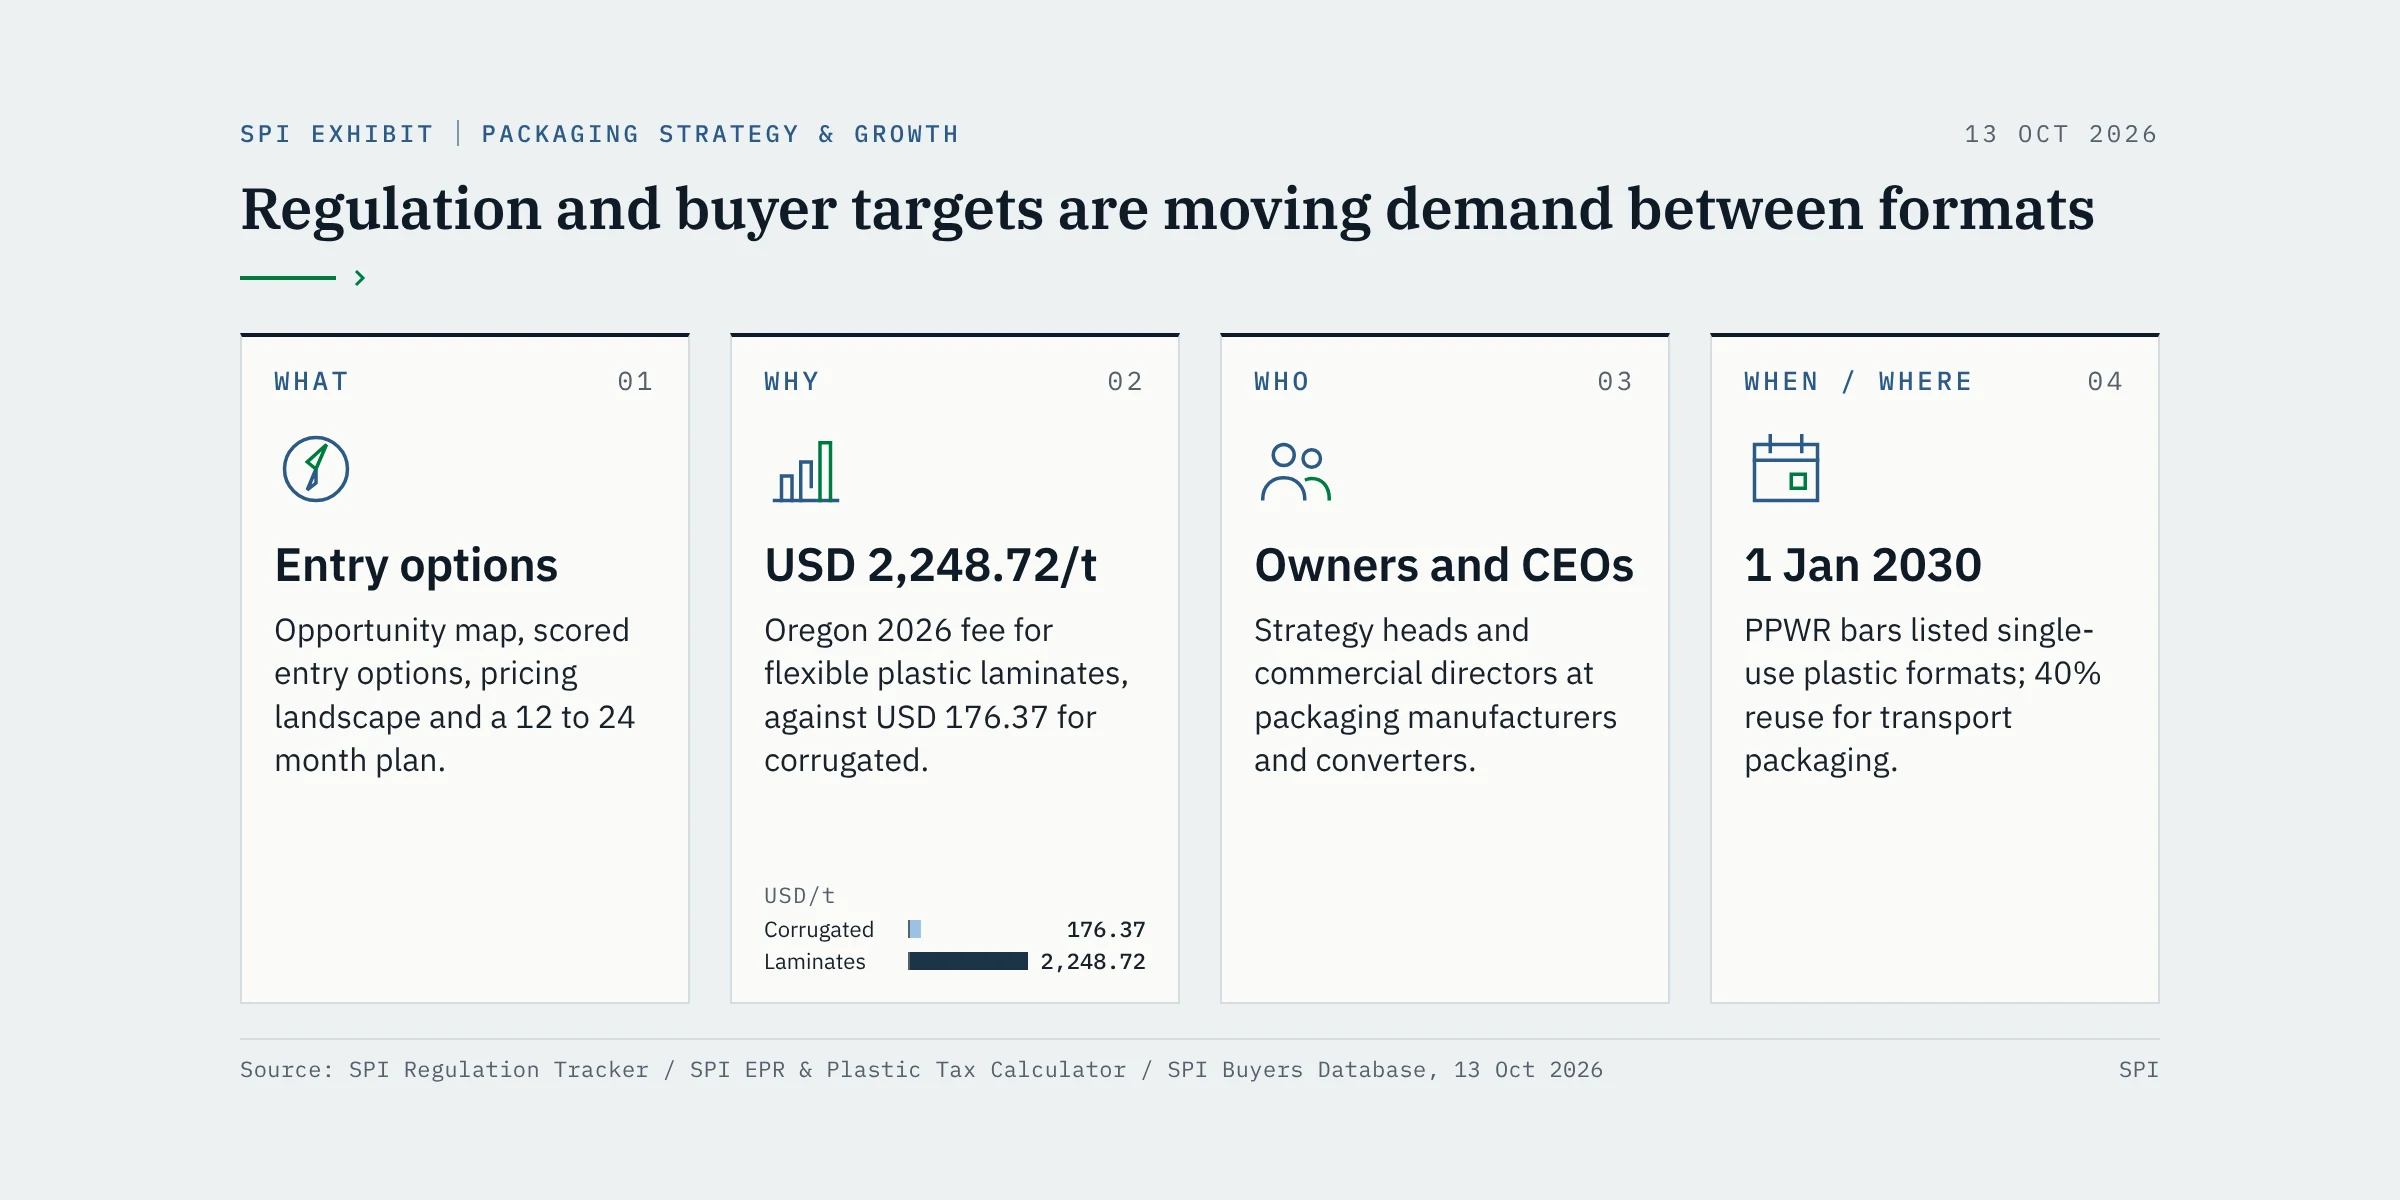
Regulation and buyer targets are moving demand between formats on published dates, and EPR fees now change what a format costs your customer. Strategic Packaging Insights (SPI) turns those signals, together with public statistics and company disclosures, into an opportunity map, entry options with their risks, a pricing landscape and a 12 to 24 month go-to-market plan.
By the SPI team · Figures as of 13 October 2026
79
Packaging rules tracked
in 25 jurisdictions, each with start dates
SPI Regulation Tracker
179
Public packaging targets
from 42 brand owners and retailers
SPI Buyers Database
216
Published fee and tax rate rows
across 14 markets
SPI EPR & Plastic Tax Calculator
13
Rules adopted with obligations still to start
dated demand shifts ahead
SPI Regulation Tracker
Source: SPI Regulation Tracker; SPI Buyers Database; SPI EPR & Plastic Tax Calculator, checked 14 Oct 2026.
Key facts
- The SPI Regulation Tracker holds 79 packaging rules, of which 13 are adopted with obligations still to start, many on 1 January 2030 under Regulation (EU) 2025/40, the PPWR (SPI Regulation Tracker, 13 October 2026).
- From 1 January 2030, Article 25 and Annex V of the PPWR bar listed single-use plastic formats, including plastic packaging for pre-packed fresh fruit and vegetables under 1.5 kg (PR-EU-008, EUR-Lex).
- From 2030 the PPWR sets binding reuse targets of 40% for transport packaging and 10% for grouped packaging (PR-EU-006).
- Circular Action Alliance’s 2026 Oregon fee schedule charges USD 176.37 per tonne for corrugated cardboard and USD 2,248.72 for plastic laminates and other flexible plastic packaging (SPI EPR & Plastic Tax Calculator).
- India’s rules require recycled plastic in Category I rigid packaging at 30% in 2025-26, rising to 60% from 2028-29 (PR-IN-002, G.S.R. 237(E)).
- India requires 70% reuse of Category I rigid drinking-water containers of 4.9 litres or more in 2025-26, rising to 85% from 2028-29 (PR-IN-003).
- Dabur India reports 2%, 6% and 1% recycled content in Category I, II and III plastic packaging of non-food items for FY 2025-26, against targets of 30%, 10% and 5% (SPI Buyers Database, Dabur India).
The problem: choosing where to grow when demand is being reallocated
Packaging manufacturers and converters used to plan growth from end-market volume: more snacks, more e-commerce, more pharma. Those drivers still matter, but in 2026 a second force sits on top of them. Rules and buyer targets are moving demand between materials and formats on dates that are already published, and fee schedules now make some formats more expensive for your customer than others. A growth plan that ignores them can put capacity into a format that loses its market, or miss a format that is about to be required.
Rules create and remove markets on fixed dates
The SPI Regulation Tracker shows the dated shifts. In the EU, the PPWR restricts listed single-use plastic formats from 1 January 2030, including plastic packaging for pre-packed fresh fruit and vegetables under 1.5 kg and packaging for food and drink consumed on the premises in the HORECA sector (PR-EU-008). The same date brings 40% reuse for transport packaging (PR-EU-006), a 50% maximum empty-space ratio for grouped, transport and e-commerce packaging (PR-EU-009) and a recyclability requirement for all packaging (PR-EU-010). In the UK, deposit return for PET, steel and aluminium drinks containers starts on 1 October 2027 (PR-GB-004, PR-GB-005).
SPI analysis
Each of these dates is both a threat and an opening. A restriction on plastic produce packaging moves volume to fibre, to loose sale or to other formats; a reuse target creates demand for returnable crates, pallets and pooling services; an empty-space cap changes box ranges and void fill. The growth question is which of these openings fits your capabilities, and how early you need to be there.
Fees change what your format costs the customer
Your customer’s total cost of a pack now includes its EPR fee, and fee schedules price formats very differently.
A converter offering a mono-material alternative to a laminate in Oregon can show the buyer a fee difference of several hundred to two thousand US dollars per tonne, from a published schedule. That is a pricing argument, and it changes from market to market: the same exercise in France, the UK or British Columbia gives different numbers in a different currency. SPI never adds or ranks fees across currencies; each market is shown in its own.
Buyer targets signal where volume will go
The SPI Buyers Database records what brand owners have promised, by when, and how far they have got. PepsiCo targets 40% or more recycled content in plastic packaging by 2035 and reports 18% for 2025. Procter & Gamble targets a 50% per-unit cut in virgin petroleum plastic by 2030 against 2018 and reports 24% for fiscal 2024/25. HEINEKEN targets 43% of volumes in reusable formats by 2030 and reports 39% for 2025 (SPI Buyers Database, company reports). Each gap is volume that someone will supply.
India: a large market where rules are setting demand now
India combines a large packaging market with rules that already bind. Plastic packaging EPR runs through Schedule II of the Plastic Waste Management Rules, 2016, with producers, importers and brand owners registering on the CPCB portal (PR-IN-001). Listed single-use plastic items have been banned since 1 July 2022, and carry bags must be at least 120 microns since 31 December 2022 (PR-IN-004). Recycled-content and reuse shares rise each year to 2028-29.
LowerHigher(shade by fifths of all values in the table)
| Category | 2025-26 | 2026-27 | 2027-28 | 2028-29 onward |
|---|---|---|---|---|
| Category I (rigid) | 30 | 40 | 50 | 60 |
| Category II | 10 | 10 | 20 | 20 |
| Category III | 5 | 5 | 10 | 10 |
Source: SPI Regulation Tracker (PR-IN-002, G.S.R. 237(E)), checked 14 Oct 2026.
Category I rigid, Category II flexible single or multilayer, Category III multilayer; percentages counted on the plastic layers only.
Indian brand owners in the SPI Buyers Database include Dabur India, Hindustan Unilever, ITC Limited, Marico, Nestlé India and Tata Consumer Products. Dabur India’s own report shows the size of the gap: 2%, 6% and 1% recycled content in Category I, II and III plastic packaging of non-food items in FY 2025-26, against targets of 30%, 10% and 5% (SPI Buyers Database).
SPI analysis
In India, the binding constraint is likely to be supply of recycled plastic that meets IS 14534:2023 and food-contact requirements, not demand. For recyclers, converters able to process documented recycled content, and suppliers of refillable rigid containers, that is a growth opportunity defined by law. It also carries risk: rules have been revised before, and unmet 2025-26 food-contact targets may be carried forward for three years (PR-IN-002), which can delay demand. A growth case has to show both.
Where this service fits
In the SPI path from Discover to Implement, Strategy & Growth sits at the Decide stage. Readers usually arrive having used the free SPI Buyers Database to see what their customers have promised (Discover), the SPI Regulation Tracker to see which rules apply where (Understand) and the SPI EPR & Plastic Tax Calculator to see what formats cost (Evaluate). The engagement turns those inputs into a choice between options and a plan, and a retainer can then track new signals against that plan each quarter.
Who this service is for
- Owners, CEOs and strategy heads at packaging manufacturers and converters deciding where to invest next.
- Commercial directors setting prices or building a case for a new format or customer segment.
- Packaging strategy teams at brand owners deciding which formats and markets to develop with suppliers.
- Material suppliers looking for converter and end-use segments where their material has a regulatory or fee advantage.
Scope: what SPI covers
- Market entry assessment for a new country, end use or format.
- Growth opportunity screening across segments, scored against criteria you agree.
- Portfolio review: which current formats are exposed to restrictions, fee penalties or buyer targets, and which gain.
- Pricing intelligence from public and supplied data, including the fee and tax effects that change your customer’s total cost.
- Go-to-market plan for the chosen options over 12 to 24 months.
How SPI scores growth options
| Criterion | Question it answers | Typical evidence |
|---|---|---|
| Demand | How large and how fast is demand for the format, and what drives it? | Public statistics, company disclosures, buyer targets in the SPI Buyers Database |
| Regulation | Do rules in force or adopted open, protect or close the segment, and from when? | SPI Regulation Tracker rules and dates |
| Competition | Who already serves it, and how concentrated is supply? | Public competitor profiles, filings, press |
| Economics | What does the format cost the customer, including fees and taxes, and what price can it bear? | SPI EPR & Plastic Tax Calculator rows, public and supplied price data |
| Fit | How well does it fit your plants, technology, customers and capital? | Your capability data |
Source: SPI Consulting service definitions; SPI Methodology, checked 14 Oct 2026.
Weights are set with you before any scoring, and each score carries its evidence and a confidence grade. Market sizes are shown as estimates with ranges and their method. This is the SPI rule of keeping sourced facts visibly apart from SPI judgement, applied to growth.
Deliverables
| Deliverable | What it contains | Format |
|---|---|---|
| Opportunity map | Segments, formats or countries scored on the agreed criteria, with evidence and confidence per score | Scorecard and chart |
| Entry and growth options | The short-listed options with benefits, risks, timing and what would need to be true | Report section |
| Pricing landscape | Public and supplied price evidence, fee and tax effects by market in their own currency | Table and commentary |
| Go-to-market plan | 12 to 24 month plan: target segments and accounts by type, proposition, milestones and decision points | Plan and timeline |
| Data annex | Sources, assumptions register, market-size ranges and methods | Spreadsheet |
Source: SPI Consulting service definitions, checked 14 Oct 2026.
Methodology: the SPI 6-step spine, applied to growth
| Step | Common to every SPI engagement | Specific to Strategy & Growth |
|---|---|---|
| 1 Scope | Scoping call and written brief | The growth decision, options in play, horizon, criteria and weights |
| 2 Source plan | Sources named with date, scope and licence | Public statistics, company disclosures, trade data where licensed, SPI datasets |
| 3 Evidence | Desk research and SPI datasets | Segment sizing, demand drivers, buyer targets, rules, fees; interviews if scoped |
| 4 Analysis | Facts separate from SPI estimates | Options scored with evidence; sizes as ranges; assumptions listed |
| 5 Check | Second-person check of numbers and sources | Each size, rate and rule re-opened on its source |
| 6 Deliver | Report, data annex, read-out call | Opportunity map, options, pricing landscape, go-to-market plan |
Source: SPI Methodology; SPI Consulting service definitions, checked 14 Oct 2026.
Sample deliverable outline (illustration only)
The outline below illustrates the format of an SPI growth review. It is not a past project. It names no commissioning company and reports no results; scores and sizes are placeholders.
| Section | What it shows | Illustrative row |
|---|---|---|
| 1 Decision and scope | The growth decision, options and criteria agreed in the brief | Enter EU fibre-based produce packaging, or expand rigid PET in India? |
| 2 Demand drivers | Dated signals by option | EU: PPWR Annex V produce restriction from 2030-01-01 (PR-EU-008); India: Category I 60% recycled content from 2028-29 (PR-IN-002) |
| 3 Opportunity map | Each option scored, with confidence | Option A demand [score, evidence]; regulation [score, rule IDs] |
| 4 Competition | Current suppliers from public profiles | [competitor] footprint and formats [source] |
| 5 Pricing landscape | Price evidence and fee effects by market | Oregon: laminate USD 2248.72 vs PE film (PRO list) USD 947.99 per tonne |
| 6 Options and risks | Short list with what must be true | Risk: implementing act timing; carry-forward of targets |
| 7 Go-to-market plan | Milestones over 12 to 24 months | Q1: [target segment]; Q3: [first trials] |
| Annex | Sources, assumptions, ranges, corrections log | Source list with consulted dates |
Source: SPI Consulting format illustration, checked 14 Oct 2026.
Rule references and fee rows are public SPI data; scores, sizes and plans are placeholders.
Formats, timelines and pricing
| Format | Typical use for this service | Typical timeline | Pricing |
|---|---|---|---|
| Briefing | One growth question tested against existing SPI data | 60-minute call and short memo | On request |
| Sprint | Entry assessment for one market or format | 2 to 4 weeks | On request |
| Programme | Opportunity screen across several segments, options, pricing and go-to-market plan | 6 to 12 weeks | On request |
| Retainer | Quarterly review of signals against the plan | Ongoing | On request |
Prices are quoted after a scoping call and fixed in a written proposal.
What SPI needs from you
- The growth decision, the options you are weighing and your planning horizon.
- Your capabilities: plants, technologies, formats, materials, certifications held and capacity headroom.
- Customer and segment data you are willing to share, and any price data for the engagement.
- Your criteria for a good option and how you would weight them.
- The person who owns the decision, and the date it must be made.
Limitations: what SPI does not do
- Market sizes are estimates shown with ranges and methods, not precise figures, and scenario results depend on the assumptions stated with them.
- Pricing intelligence uses public and supplied data only. SPI does not seek competitors’ non-public prices.
- SPI does not invent contacts, purchase volumes, supplier relationships or packaging specifications; gaps are reported as gaps.
- SPI does not give financial, tax or legal advice, and its plans are not investment recommendations.
SPI Trackers this service draws on
- SPI Regulation Tracker: the rules and dates that open or close segments, including 13 adopted rules with obligations still to start.
- SPI Buyers Database: 179 public packaging targets from 42 brand owners and retailers, as demand signals.
- SPI EPR & Plastic Tax Calculator: 216 published rate rows in 14 markets, for the fee side of pricing.
Related services: SPI Packaging Market & Competitive Intelligence for a deeper competitor view, SPI Packaging Regulatory Intelligence for full rule mapping, and SPI Sustainable Packaging Strategy for material alternatives. Readers can start from SPI Intelligence for Packaging manufacturers or SPI Intelligence for Converters, and read what EPR fees cost per tonne in 2026.
How to enquire
Send the enquiry form or write to sales@strategicpackaginginsights.com with the growth decision, the options you are weighing and your deadline. The SPI team aims to reply within two business days, then holds a scoping call and sends a written proposal with a fixed price.
Frequently asked questions
What is a packaging strategy?
A packaging strategy sets which segments, formats, materials and markets a company will compete in, how it will win there and in what order. For a manufacturer or converter, it now has to account for dated rules, buyer targets and EPR fees as well as end-market growth.
How do you decide which packaging market to enter?
SPI scores each option on demand, regulation, competition, economics and fit with your capabilities, using weights agreed before scoring. Each score shows its evidence and a confidence grade, so the ranking can be challenged.
How do EPR fees affect packaging pricing?
EPR fees are part of the customer’s total cost of a pack and differ widely by format. In Circular Action Alliance’s 2026 Oregon schedule, corrugated cardboard is USD 176.37 per tonne and plastic laminates are USD 2,248.72 per tonne, so a lower-fee format can support a price case. SPI shows fee effects market by market in each currency.
What are India's plastic packaging rules for recycled content?
India’s Plastic Waste Management Rules, as revised by G.S.R. 237(E) in 2026, set recycled-plastic shares for Category I rigid packaging of 30% in 2025-26 rising to 60% from 2028-29, with lower shares for Categories II and III. Producers, importers and brand owners register on the CPCB EPR portal.
Can you give us market size figures?
Yes, as estimates with a stated range, method and base year, built from public statistics and company disclosures. SPI does not present a market size as a precise figure.
Do you write the go-to-market plan or carry it out?
SPI writes the plan: target segments, proposition, milestones and decision points over 12 to 24 months. Your team carries it out; a retainer can review progress and new signals each quarter.
Is this investment advice?
No. SPI Packaging Strategy & Growth is commercial decision support. It is not financial, tax or legal advice, and its plans are not investment recommendations.
Sources
- SPI Regulation Tracker and SPI rule notes, /data/packaging-regulation-tracker/, data as of 13 October 2026.
- SPI Buyers Database, /data/packaging-buyers-database/, data as of 13 October 2026; each target links to the company report it is quoted from (including PepsiCo, Procter & Gamble, HEINEKEN and Dabur India reports cited there).
- SPI EPR & Plastic Tax Calculator, /data/epr-plastic-tax-calculator/, data as of 13 October 2026.
- Circular Action Alliance: 2026 Oregon Producer Fee Schedule, https://static1.squarespace.com/static/64260ed078c36925b1cf3385/t/693b2c9103be112d168e1b19/1765485713621/OR+2026+Fee+Schedule+Public.pdf, as given in the SPI EPR & Plastic Tax Calculator, checked 13 October 2026.
- MoEFCC Gazette G.S.R. 237(E), https://www.mpcb.gov.in/sites/default/files/standing_orders/Plastic_Waste_Management_2026.pdf, checked 13 October 2026.
- NGT: CPCB reply in OA 1179 of 2024, https://www.greentribunal.gov.in/sites/default/files/news_updates/REPLY BY R-2 CPCB IN OA NO. 1179 of 2024 HARIYALI WELFARE SOCIETY VS UNION OF INDIA.pdf, checked 13 October 2026.
- MoEFCC Gazette G.S.R. 571(E), https://www.mpcb.gov.in/sites/default/files/standing_orders/3Plastic_Waste_Management_Rules_2016_%28Second_Amendments%29_2021.pdf, checked 13 October 2026.
- EUR-Lex: Regulation (EU) 2025/40 (PPWR), Article 25 and Annex V, https://eur-lex.europa.eu/eli/reg/2025/40/oj/eng, checked 13 October 2026.
- European Parliament Legislative Observatory: Regulation (EU) 2025/40 summary, https://oeil.europarl.europa.eu/oeil/en/document-summary?id=1802233, checked 13 October 2026.
- legislation.gov.uk: SI 2025/67, https://www.legislation.gov.uk/uksi/2025/67/made, checked 13 October 2026.
Ask the SPI team
What changes for your packaging next quarter?
Tell us your markets and materials. The SPI team walks you through the rules and buyer commitments that affect them.
Prefer email? Write to sales@strategicpackaginginsights.com.
- Q1
Which packaging rules apply to us in each market we sell in?
We map each market's EPR, tax, ban, recycled-content, labelling and deposit rules against your materials and formats, and show which are in force, adopted or only proposed.
- Q2
What could EPR fees and plastic taxes cost us next year?
We apply published fee tables and tax rates to your tonnages and recycled content, and show the result as scenarios with every rate sourced.
- Q3
Can you tell us when a rule changes?
Yes. The free tracker alerts cover rule changes by country; a monitoring retainer adds monthly notes on what the changes mean for your portfolio.