
SPI Packaging Market & Competitive Intelligence: Competitor Benchmarks, Demand Drivers and Geographies
SPI Packaging Market & Competitive Intelligence gives packaging manufacturers, converters, material suppliers and investors a sourced view of who they compete with, which buyer commitments and rules are moving demand, and which geographies are worth entering, built from public and licensed information only.
Demand for packaging formats is now shaped as much by brand-owner targets and regulation as by end-market growth, and both are public if you know where to look. Strategic Packaging Insights (SPI) assembles that evidence into competitor profiles, benchmark tables, a demand-driver analysis and a geography ranking, with every fact sourced and dated.
By the SPI team · Figures as of 13 October 2026
42
Brand owners and retailers profiled
headquartered in 9 countries
SPI Buyers Database
179
Public packaging targets
each quoted from the company's own report
SPI Buyers Database
79
Packaging rules tracked
in 25 jurisdictions
SPI Regulation Tracker
216
Published fee and tax rate rows
across 14 markets
SPI EPR & Plastic Tax Calculator
Source: SPI Buyers Database; SPI Regulation Tracker, checked 14 Oct 2026.
Key facts
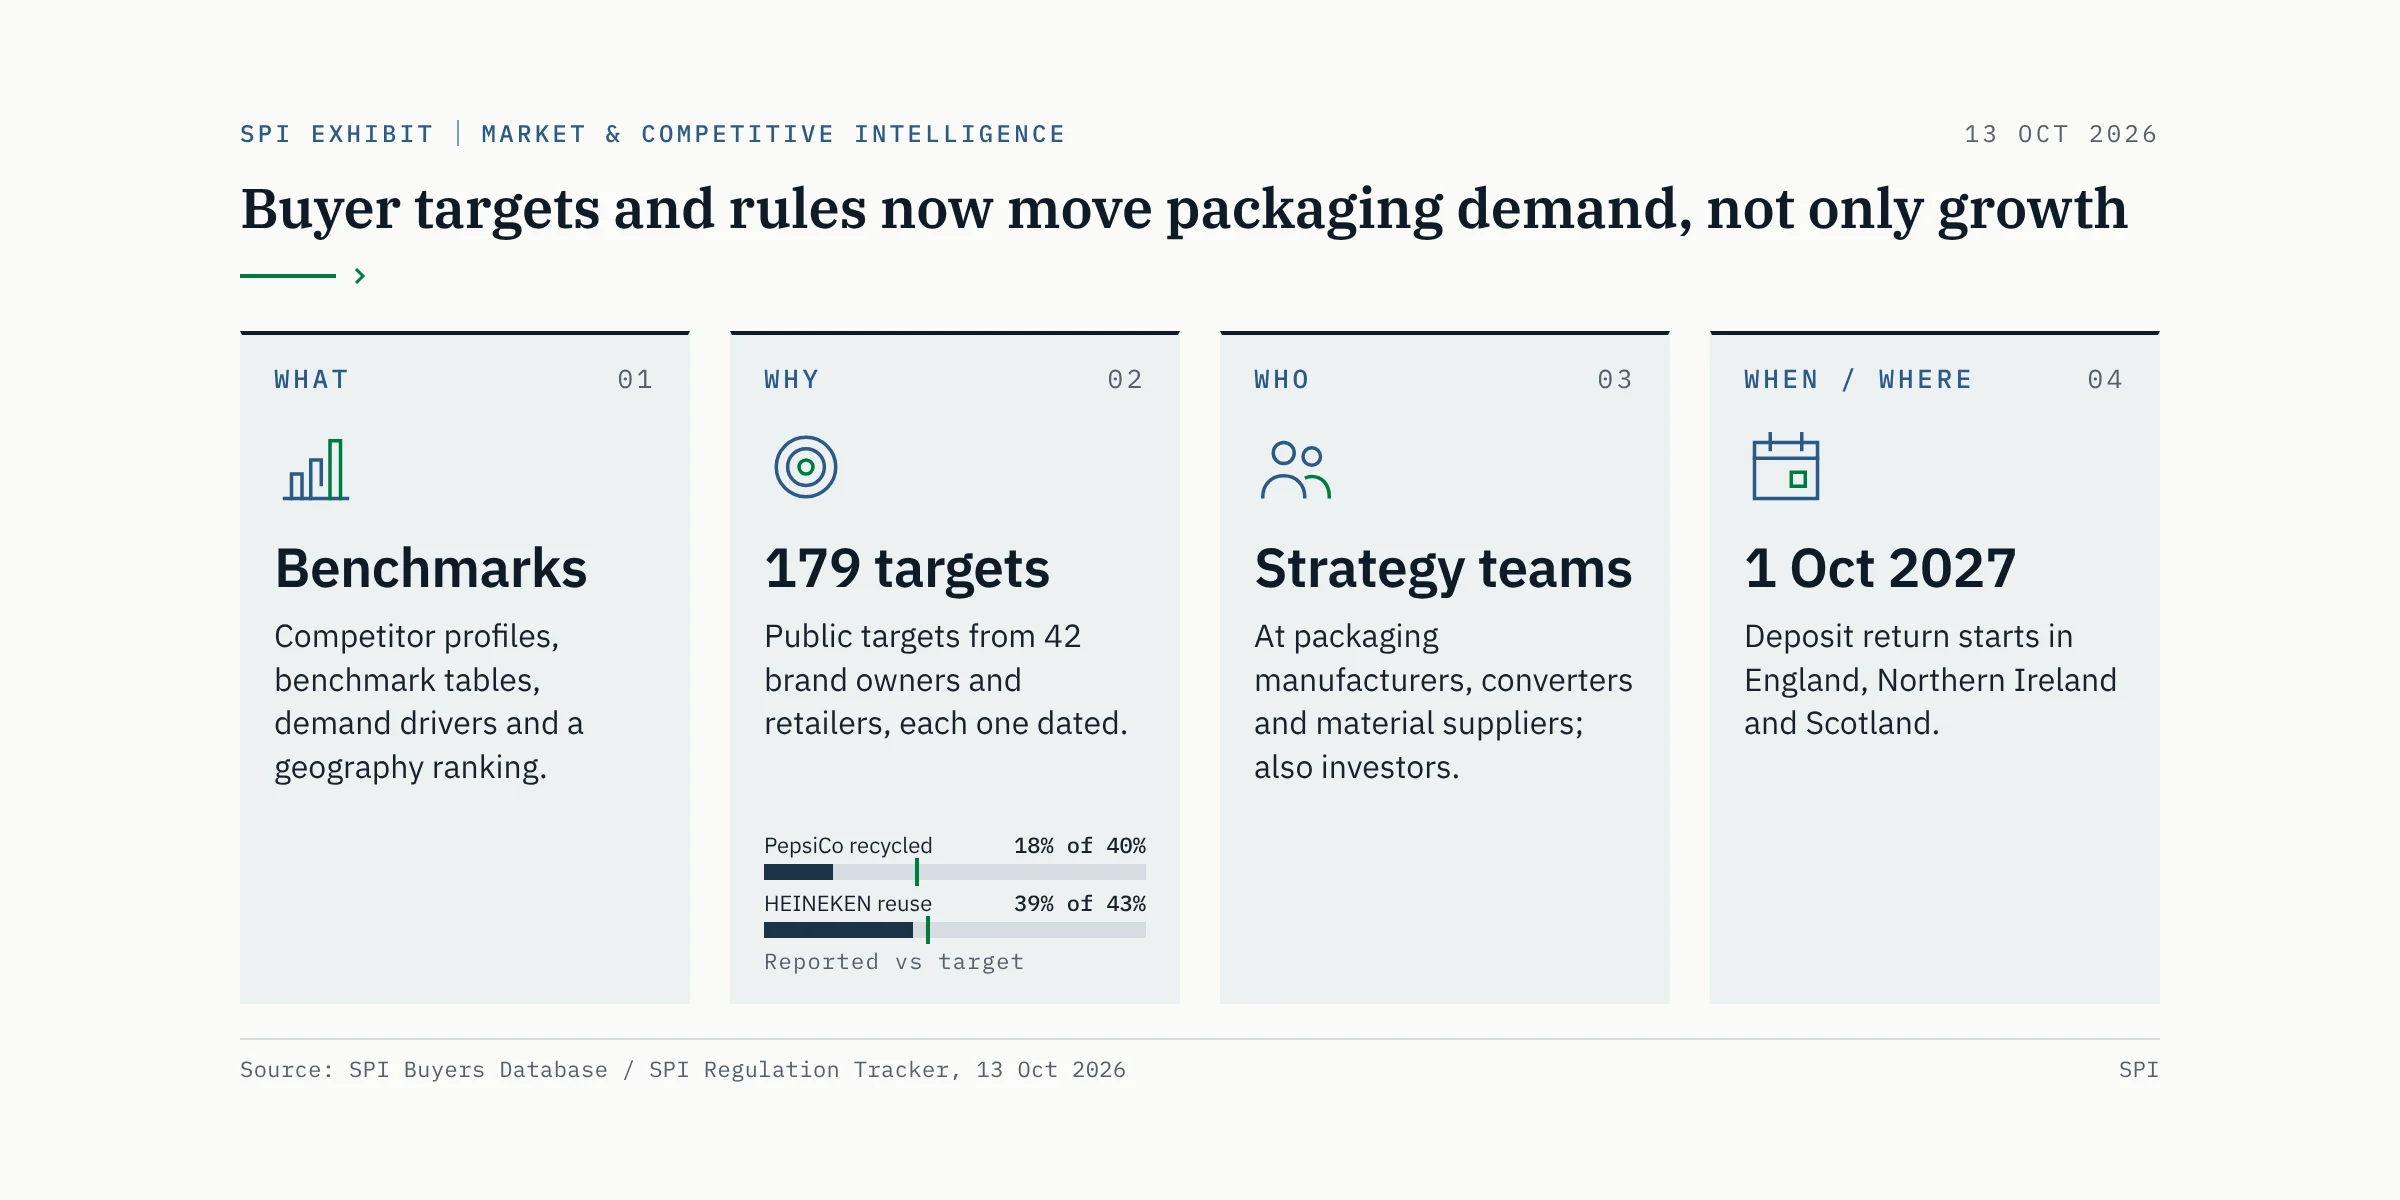
- The SPI Buyers Database profiles 42 brand owners and retailers with 179 public packaging targets, each quoted from the company’s own report with a date (SPI Buyers Database, 13 October 2026).
- PepsiCo targets 40% or more recycled content in plastic packaging by 2035 or sooner and reports 18% for 2025 (SPI Buyers Database, PepsiCo).
- HEINEKEN targets 43% of volumes sold in reusable formats by 2030 and reports 39% for 2025 (SPI Buyers Database, HEINEKEN).
- Procter & Gamble targets a 50% per-unit cut in virgin petroleum plastic in consumer packaging by 2030 against 2018 and reports 24% for fiscal 2024/25 (SPI Buyers Database, Procter & Gamble).
- From 1 January 2030, Article 25 and Annex V of Regulation (EU) 2025/40 bar listed single-use plastic formats, including plastic packaging for pre-packed fresh fruit and vegetables under 1.5 kg (PR-EU-008, EUR-Lex).
- England, Northern Ireland and Scotland start deposit return for PET, steel and aluminium drinks containers on 1 October 2027 (PR-GB-004, PR-GB-005).
- Viet Nam’s Decree 110/2026/ND-CP, effective 25 May 2026, sets mandatory packaging recycling rates of 22% for aluminium and rigid PET and 10% for flexible plastic (PR-VN-001).
The problem: demand is moving for reasons a sales pipeline does not show
A converter or material supplier usually sees demand through its order book. In packaging, that view now lags the real signals by years. The decisions that will move volume between formats in 2027 to 2030 have, in many cases, already been published: as brand-owner targets with dates, and as rules with start dates. Teams that read those signals early can position capacity and sales effort ahead of competitors. Teams that wait see them as lost tenders.
Buyer targets are specific, dated and public
Large brand owners publish packaging targets with a metric, a baseline, a deadline and annual progress. The distance between the latest figure and the target is a direct indicator of what they will need to buy.
- Target
- Latest
Source: SPI Buyers Database (company reports), checked 13 Oct 2026.
Latest reported figure against each target; reporting years differ (2024, 2025 or fiscal 2024/25); targets are company-defined and not directly comparable.
Show the data
| Company target | Target | Latest |
|---|---|---|
| PepsiCo, recycled content in plastic packaging by 2035 | 40 | 18 |
| Keurig Dr Pepper, PCR in primary plastic by 2035 (lower bound) | 25 | 16 |
| Procter & Gamble, virgin plastic cut per unit by 2030 | 50 | 24 |
| Kimberly-Clark, plastics footprint cut by 2030 | 50 | 16 |
| Mondelez International, rigid virgin plastic cut by 2030 | 25 | 8.4 |
| The Kraft Heinz Company, virgin plastic cut by 2030 | 20 | 2 |
| HEINEKEN, volumes sold in reusable formats by 2030 | 43 | 39 |
| HEINEKEN, recycled content in bottles and cans by 2030 | 50 | 48 |
| Diageo, recycled content in packaging by 2030 | 50 | 47 |
SPI analysis
The gaps point to different kinds of demand. A large recycled-content gap, as at PepsiCo, means demand for food-grade recycled resin and for converters who can document it. A virgin-plastic reduction gap, as at Procter & Gamble or Kraft Heinz, can be closed by lightweighting, recycled content or material substitution, so it is contestable between plastic, paper and other suppliers. A reuse target, as at HEINEKEN, moves demand towards returnable glass and crates. Reading the metric, not just the headline, tells you which competitors stand to gain.
The companies behind these targets are concentrated in a few end uses. Food and personal care lead the SPI Buyers Database, followed by beverage, retail and pharma, so a converter serving those end uses can read a large share of its customers’ public intentions in one place. A company can sit in more than one end use.
Rules open and close segments on fixed dates
The SPI Regulation Tracker shows rules that remove some formats and create demand for others:
- Bans and restrictions. From 1 January 2030 the PPWR bars listed single-use plastic formats, including plastic packaging for pre-packed fresh fruit and vegetables under 1.5 kg and packaging for food and drink filled and consumed on the premises in the HORECA sector (PR-EU-008). California restricts expanded polystyrene food service ware from 1 January 2025 for producers, because EPS did not meet the 25% recycling rate (PR-US-005). Washington banned EPS foam food service products from 1 June 2024 (PR-US-012), and Oregon banned polystyrene foam foodware from 1 January 2025 (PR-US-013).
- Deposit return. Drinks deposit return starts in England, Northern Ireland and Scotland on 1 October 2027 (PR-GB-004, PR-GB-005). The PPWR requires 90% separate collection of single-use plastic bottles and metal cans up to 3 litres by 1 January 2029 (PR-EU-007). Collection systems change both the recycled resin supply and the formats brands choose.
- Recycling and recycled-content floors. Viet Nam’s Decree 110/2026/ND-CP sets mandatory recycling rates by packaging material from 25 May 2026 (PR-VN-001), and India’s Plastic Waste Management Rules, as revised by the 2026 amendment rules, set Category I rigid plastic recycled content rising to 60% from 2028-29 (PR-IN-002).
Regulatory intensity differs sharply by geography
By jurisdiction, ranked
Source: SPI Regulation Tracker, checked 14 Oct 2026.
Shown by jurisdiction as a ranked list. Counts of rules in the SPI Regulation Tracker by jurisdiction; EU-level rules are shown under EU, national rules under each Member State; US and Canada include state and provincial rules.
Show the data
| ISO2 | Value | Label |
|---|---|---|
| EU | 18 | European Union |
| US | 13 | United States |
| GB | 7 | United Kingdom |
| CA | 6 | Canada |
| IN | 4 | India |
| CN | 3 | China |
| FR | 3 | France |
| AU | 2 | Australia |
| CO | 2 | Colombia |
| DE | 2 | Germany |
| ES | 2 | Spain |
| JP | 2 | Japan |
| KE | 2 | Kenya |
| NZ | 2 | New Zealand |
| AE | 1 | United Arab Emirates |
| AT | 1 | Austria |
| BR | 1 | Brazil |
| CL | 1 | Chile |
| ID | 1 | Indonesia |
| IE | 1 | Ireland |
| PH | 1 | Philippines |
| PL | 1 | Poland |
| PT | 1 | Portugal |
| VN | 1 | Vietnam |
| ZA | 1 | South Africa |
Rule count is not attractiveness. A dense rulebook raises compliance cost but also sets clear, dated demand for compliant formats; a thin one may mean less certainty, not less change. A geography ranking has to weigh regulation alongside demand, competition and fit with your capabilities, and SPI shows the weight given to each.
Who this service is for
- Strategy and business development teams at packaging manufacturers, converters and material suppliers who need a sourced view of competitors and demand before a planning cycle.
- Marketing teams preparing positioning against named competitors in a segment.
- Investors and corporate development teams who need a market and competitor view of a packaging segment. For a full transaction view, see SPI Packaging Investment & Transaction Intelligence.
Scope: what SPI covers
- Market assessment for a material, format or end use: what drives demand, what restrains it, and what is changing.
- Competitor benchmarking from public information: capabilities, footprint, formats, stated strategy, sustainability claims and recent moves.
- Demand-driver analysis, linking buyer targets in the SPI Buyers Database and rules in the SPI Regulation Tracker to the formats and materials they affect.
- Geographic opportunity ranking on criteria you agree, with the evidence and weight behind each score.
- Company intelligence on specific buyers or competitors, from filings, reports, press and licensed data.
Deliverables
| Deliverable | What it contains | Format |
|---|---|---|
| Competitor profiles | A structured profile per competitor from public information: footprint, formats, materials, end markets, stated strategy, sustainability claims, recent investments, each fact sourced | Profile pack |
| Benchmark tables | Competitors compared on the criteria you choose, with "not disclosed" shown where it applies | Spreadsheet and report section |
| Demand-driver analysis | Buyer targets and rules mapped to the formats and materials they move, with dates | Report section with charts |
| Geography ranking | Markets scored on demand, competition, regulation and fit, with criteria and weights shown | Scorecard and commentary |
| Quarterly update (optional) | Changes to competitors, buyer targets and rules since the last edition | Quarterly note |
Source: SPI Consulting service definitions, checked 14 Oct 2026.
Methodology: the SPI 6-step spine, applied to markets and competitors
| Step | Common to every SPI engagement | Specific to Market & Competitive Intelligence |
|---|---|---|
| 1 Scope | Scoping call and written brief | Segment, competitor list, geographies and benchmark criteria |
| 2 Source plan | Sources named with date, scope and licence | Annual reports, filings, company sites, press, trade data where licensed |
| 3 Evidence | Desk research and SPI datasets | Structured profile template filled per company; SPI Buyers Database and Regulation Tracker for demand drivers |
| 4 Analysis | Facts separate from SPI estimates | Disclosed figures shown apart from SPI estimates; scores with stated weights |
| 5 Check | Second-person check of numbers and sources | Each profile fact re-opened on its source |
| 6 Deliver | Report, data annex, read-out call | Profiles, benchmark tables, demand drivers, geography ranking |
Source: SPI Methodology; SPI Consulting service definitions, checked 14 Oct 2026.
The structured template means every competitor is described on the same fields, so gaps are visible: if one competitor does not disclose capacity or recycled-content use, the table says “not disclosed” rather than filling the cell with a guess. Market size, where it is needed, is shown as an estimate with a stated range and its method, never as a single precise figure. See the SPI Methodology for how SPI separates sourced facts from estimates.
How SPI turns signals into a demand view
The demand-driver analysis follows a fixed chain, so the reasoning can be checked:
- Signal. A dated, sourced fact: a buyer target, a rule, a fee change. For example, HEINEKEN’s 43% reusable-volume target for 2030, or the PPWR Annex V restrictions from 1 January 2030.
- Affected formats. Which materials and formats the signal moves towards or away from, and in which markets.
- Timing. When the effect is likely to start, tied to the target deadline or rule date, with any dependency such as a pending implementing act.
- Who gains. Which competitors are positioned for the shift, on public evidence of their formats and footprint.
- Confidence. How firm the signal is: a rule in force, an adopted rule with a future date, a proposal, or a company ambition without a baseline.
SPI analysis
Confidence is the step most market studies skip. An adopted rule with a fixed date is a stronger demand signal than a voluntary target, and a voluntary target with reported annual progress is stronger than one with none. In the SPI Buyers Database, many targets have no reported outcome, and SPI weights them accordingly.
Sample deliverable outline (illustration only)
The outline below illustrates the format of an SPI competitor benchmark. It is not a past project. It names no commissioning company and reports no results; the rows show the fields and the kind of source each carries.
| Section | What it shows | Illustrative row |
|---|---|---|
| 1 Decision and scope | Segment, geographies and criteria agreed in the brief | Rigid PET food packaging, EU and UK |
| 2 Market drivers | Signals with dates and confidence | PPWR 30% recycled content in single-use plastic beverage bottles from 2030 (PR-EU-004), adopted |
| 3 Buyer demand | Relevant buyer targets and progress | [named buyers] recycled-content target, deadline, latest figure, source |
| 4 Competitor profiles | One template per competitor | [competitor]: sites [source], formats [source], recycled-content claim [source], capacity: not disclosed |
| 5 Benchmark table | Competitors on agreed criteria | Criterion: documented food-grade recycled content; evidence per competitor |
| 6 Geography ranking | Scores and weights by market | Regulation weight 25%: [market] score with rule IDs |
| 7 Implications | SPI analysis, labelled | Where the segment is contestable and by whom |
| Annex | Sources, assumptions, corrections log | Source list with consulted dates |
Source: SPI Consulting format illustration, checked 14 Oct 2026.
Buyer and rule rows are public SPI data; competitor fields are placeholders.
Formats, timelines and pricing
| Format | Typical use for this service | Typical timeline | Pricing |
|---|---|---|---|
| Briefing | One question on one segment or buyer group, from existing SPI data | 60-minute call and short memo | On request |
| Sprint | Benchmark of up to a handful of competitors in one segment and region | 2 to 4 weeks | On request |
| Programme | Market assessment, full competitor set, demand drivers and geography ranking | 6 to 12 weeks | On request |
| Retainer | Quarterly updates on competitors, buyer targets and rules | Ongoing | On request |
Prices are quoted after a scoping call and fixed in a written proposal.
What SPI needs from you
- The segment definition: materials, formats, end uses and geographies.
- Your competitor list, or the criteria for building one.
- The benchmark criteria that matter to your decision, and their relative weight.
- Your own capabilities and footprint, so the geography ranking can score fit.
- Any licensed market or trade data you hold and can share for the engagement.
Limitations: what SPI does not do
- Public and licensed sources only. SPI does not seek non-public or improperly obtained competitor information, and declines requests that need it.
- SPI does not collect personal contact data or build contact lists.
- Market sizes are estimates with stated ranges and methods, not precise figures.
- The SPI Buyers Database holds company-reported targets and progress. SPI quotes them with their source and does not audit them, and it holds no contacts, purchase volumes, supplier relationships or specifications.
- Regulatory content is decision support, not legal advice.
SPI Trackers this service draws on
- SPI Buyers Database: 42 brand owners and retailers with 179 public packaging targets and their reported progress.
- SPI Regulation Tracker: 79 rules in 25 jurisdictions, used for the regulatory side of demand and the geography ranking.
- SPI EPR & Plastic Tax Calculator: fee differences by format that shift buyer preferences.
Related services: SPI Packaging Strategy & Growth turns this view into entry options and a go-to-market plan, and SPI Packaging Procurement & Supplier Intelligence applies the same public-source approach to suppliers. Readers can start from SPI Intelligence for Packaging manufacturers or SPI Intelligence for Converters.
How to enquire
Send the enquiry form or write to sales@strategicpackaginginsights.com with the segment, competitors and geographies you have in mind and your decision deadline. The SPI team aims to reply within two business days, then holds a scoping call and sends a written proposal with a fixed price.
Frequently asked questions
What is packaging market intelligence?
It is a sourced view of a packaging segment: what drives and restrains demand, who competes and how, and where opportunity lies. SPI builds it from public filings, company reports, press, licensed data, the SPI Buyers Database and the SPI Regulation Tracker, with every fact dated.
How do you benchmark competitors without inside information?
SPI uses only public and licensed sources, filled into the same structured template for every competitor. Where a competitor does not disclose a figure, the benchmark says “not disclosed”. SPI does not seek non-public or improperly obtained information.
Which brand-owner commitments drive packaging demand?
Recycled-content, virgin-plastic reduction, recyclability and reuse targets are the main ones. The SPI Buyers Database records 179 such targets from 42 companies, for example PepsiCo’s 40% recycled content in plastic packaging by 2035 and HEINEKEN’s 43% reusable volumes by 2030.
Can you size a packaging market?
Yes, as an estimate with a stated range, method and base year, built from public statistics and company disclosures. SPI does not present a market size as a precise figure, and says where the underlying data is thin.
Which countries have the most packaging regulation?
In the SPI Regulation Tracker, the European Union has the most rules at EU level, followed by the United States, where rules are made by states, the United Kingdom and Canada. National rules in EU Member States such as France, Germany and Spain sit on top of the EU rules.
Do you provide contact lists of packaging buyers?
No. SPI does not collect or sell personal contact data. The SPI Buyers Database covers company-level public commitments and progress, with no contacts, volumes, suppliers or specifications.
How often can the benchmark be updated?
A retainer adds a quarterly update covering changes to competitors, buyer targets and rules since the previous edition, with a read-out call.
Sources
- SPI Buyers Database, /data/packaging-buyers-database/, data as of 13 October 2026; each target links to the company report it is quoted from (including PepsiCo, Keurig Dr Pepper, Procter & Gamble, Kimberly-Clark, Mondelez International, The Kraft Heinz Company, HEINEKEN and Diageo reports cited there).
- SPI Regulation Tracker and SPI rule notes, /data/packaging-regulation-tracker/, data as of 13 October 2026.
- SPI EPR & Plastic Tax Calculator, /data/epr-plastic-tax-calculator/, data as of 13 October 2026.
- EUR-Lex: Regulation (EU) 2025/40 (PPWR), Article 25 and Annex V, https://eur-lex.europa.eu/eli/reg/2025/40/oj/eng, as given in the SPI Regulation Tracker, checked 13 October 2026.
- European Parliament Legislative Observatory: Regulation (EU) 2025/40 summary, https://oeil.europarl.europa.eu/oeil/en/document-summary?id=1802233, checked 13 October 2026.
- legislation.gov.uk: SI 2025/67, https://www.legislation.gov.uk/uksi/2025/67/made, checked 13 October 2026.
- legislation.gov.uk: SSI 2025/188, https://www.legislation.gov.uk/ssi/2025/188/article/3, checked 13 October 2026.
- CalRecycle: EPS Food Service Ware Requirements, https://calrecycle.ca.gov/packaging/packaging-epr/eps/, checked 13 October 2026.
- Washington Ecology news release, 29 May 2024, https://ecology.wa.gov/about-us/who-we-are/news/2024/may-29-eps-foam-clamshell-containers-plates-bowls-cups-trays-and-coolers-are-banned-for-sale, checked 13 October 2026.
- Oregon DEQ: Foodware Containers and Polystyrene Foam, https://www.oregon.gov/deq/mm/production/pages/polystyrene.aspx, checked 13 October 2026.
- Official Gazette of Viet Nam: Decree 110/2026/ND-CP, https://congbaocdn.chinhphu.vn/180507251028987904/2026/4/20/469301-1776647243_v1_1776647876_signed.pdf, checked 13 October 2026.
- MoEFCC Gazette G.S.R. 237(E), https://www.mpcb.gov.in/sites/default/files/standing_orders/Plastic_Waste_Management_2026.pdf, checked 13 October 2026.
Ask the SPI team
What changes for your packaging next quarter?
Tell us your markets and materials. The SPI team walks you through the rules and buyer commitments that affect them.
Prefer email? Write to sales@strategicpackaginginsights.com.
- Q1
Which packaging rules apply to us in each market we sell in?
We map each market's EPR, tax, ban, recycled-content, labelling and deposit rules against your materials and formats, and show which are in force, adopted or only proposed.
- Q2
What could EPR fees and plastic taxes cost us next year?
We apply published fee tables and tax rates to your tonnages and recycled content, and show the result as scenarios with every rate sourced.
- Q3
Can you tell us when a rule changes?
Yes. The free tracker alerts cover rule changes by country; a monitoring retainer adds monthly notes on what the changes mean for your portfolio.